This was another really fun project. It was fun for many reasons, but mainly because it was another project that
involved the use of mechanical hardware, electrical hardware, as well as software.
The inspiration for this project arose one day when I was involved in the discussion of preparing homes that aren’t
used for the winter. This often involves flushing pipes, draining toilets, etc. Often the power to the house will be
turned off as well. For homes that have security systems or cameras, this is often undesirable. In this situation
one idea is to use a small solar panel to power only low voltage systems such as a few cameras and motion sensors,
as well as, possibly, a router for internet access (for access to the security system from outside the home network).
In order to correctly size a solar panel and batteries a few important factors must be known. Factors such as how much
sun the location gets year round, how long rainy or cloudy spells last, and how much power is required. For example,
in a location that gets a bright or overcast sky 350 days of the year, with cloudy/rainy days lasting no more than 24
hours, a small solar panel that produces only a peak of 125% of the required power might be fine. A battery that stores
enough energy for only 24 hours of darkness might be enough to prevent any interruption throughout the entire year.
Other geographic locations may require batteries that can supply power for a full week of rain, and a solar panel large
enough to recharge those batteries in the following two days of sun.
These factors are what’s called Typical Meteorological Year Data (TMY Data) and include many many more data than from
Sunlight alone. Earthquakes, wind-speeds, temperatures, magnetic flux densities, etc. are all included in TMY data.
There are of course plenty of websites that collect these data for different geographical locations, making this simple
homemade project redundant. But, honestly, where’s the fun in using pre gathered data? Empirical testing is where it’s at.
At first, the plan was to record only sunlight via a small solar panel, but “In for a penny, in for a pound” I say. So
I eventually decided to record wind speed, sunlight, as well as ambient temperature. I wanted the electronics to be
powered by the solar panel itself, of course. This creates a sort of chicken and egg problem, because it there isn't
enough sunlight, the system will fail to record said lack of sunlight. A partial solution to this is to include
a real-time clock that keeps accurate time under it's own power. However, I ended up using
solar panels and batteries that where so grossly oversized, that I didn’t have to worry about running out of power.
The project was broken into multiple parts. The solar panels - This was easy, I happened to have two 4.5 watt, 20 volt
solar panels that are waterproof and UV protected. The battery - Also fairly simple, an old lawnmower’s 12 volt sealed
lead acid battery worked perfectly. The anemometer is conceptually simple. It consists of a few PVC pipes with cheap
plastic bowls screwed to the ends to form wind catching cups. A threaded rod sits in the center of the pipe. The rod is
sharpened to a point on the top, and a steel cap sits on the sharpened point to support the weight of the anemometer as
well as allowing it to rotate with very little friction. A bearing sits at the very bottom to prevent any side to side
movement.
Below is a picture of the anemometer after years of continuous opperation.
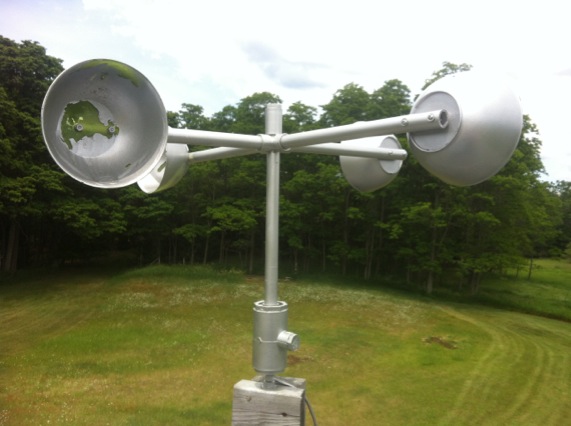
The PVC and cheap plastic bowls are not UV protected, so the entire anemometer received a coat of silver paint.
You can see that after thousands of hours of sunlight and freezing temperatures, the paint has started to peel off.
The PVC “T” contains a bearing as well as a hall switch. The hall switch sends a digital signal to the electronics
when a strong magnetic field is present. The small portion sticking out of the side of the PVC “T” contains a few disk
magnets that trigger the hall switch. Together, these are used to determine the speed at which the anemometer is rotating.
It does this by counting the time between pulses from the hall switch, and calculating the anemometers’ RPM. Calibrating
the anemometer wasn’t easy, but I managed to correlate its speed to the speed indicated by a car’s speedometer by sticking
the anemometer up and out of the window, and making a number of passes back and forth on a long straight road.
Below you can see how the anemometer and solar panels are mounted on the roof of the backyard shed. The solar panels are
angled southward to gather as much light as possible throughout the year.
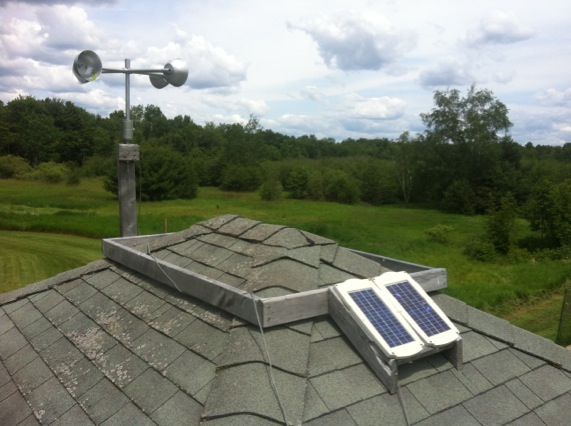
UV resistant wires run down into the shed to the battery, as well as through a conduit into the garage where the rest of
the electronics are stored.
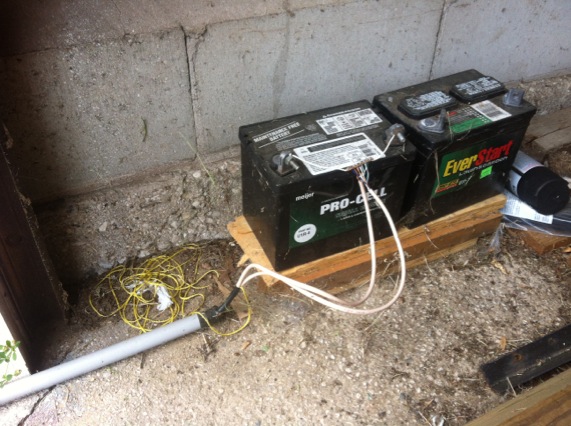
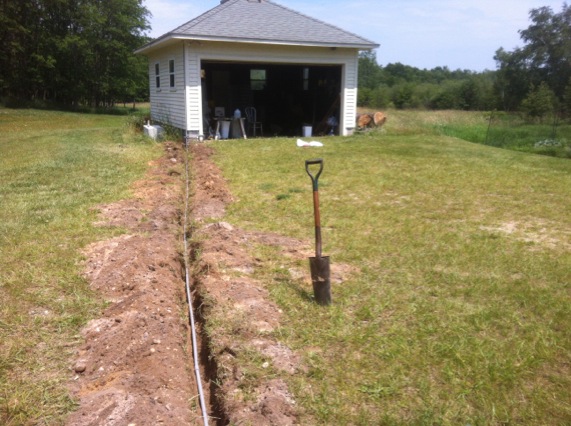
The battery(s) and conduit can be seen below. The conduit was buried for convenience. As the system carries low current
and low voltage, adhering to building codes was not important to me.
The rest of the electronics are comprised of voltage regulators and micro-controllers.
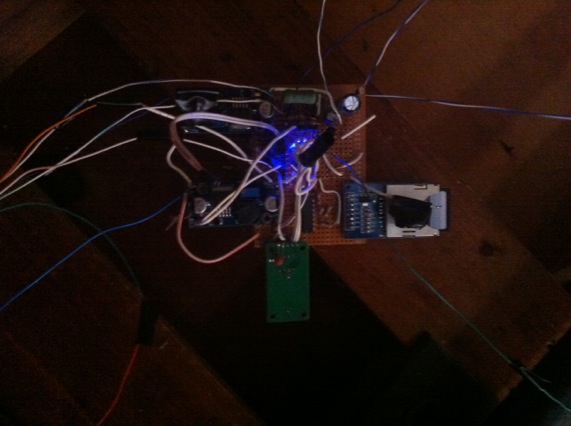
The final circuit board can be seen below. Due to many revisions and additions, it’s quite a mess. However I’m proud to
say that after running continuously for more than twelve thousand hours, it hasn’t missed a beat.
The main circuit board has a number of functions. Firstly it must record data from each of the sensors in the system.
Two temperature sensors placed at different locations in and around the garage are fairly simple to read. The battery
voltage is measured by scaling its voltage down to 5 Volts with a simple resistive divider, and then measured by the
micro controller’s built in ADC.
 The unloaded voltage from the solar panel can be measured in the same manner, however I also wanted to be able to measure
the Maximum Power Point. To do this the microcontroller uses a MOSFET as a variable resistor, and measures the voltage and
current repeatedly. Using these measurements, the peak power can be calculated. This is important because solar panels are
so extremely non linear, that it's difficult to know how much to load them (electrically) for any given amount of sunlight.
The unloaded voltage from the solar panel can be measured in the same manner, however I also wanted to be able to measure
the Maximum Power Point. To do this the microcontroller uses a MOSFET as a variable resistor, and measures the voltage and
current repeatedly. Using these measurements, the peak power can be calculated. This is important because solar panels are
so extremely non linear, that it's difficult to know how much to load them (electrically) for any given amount of sunlight.
The wind speed is measured by timing each revolution of the anemometer, and calculating the wind speed for that revolution.
The system records collected data every ten minutes, so the average wind speed during each ten minute interval is recorded
along with the maximum windspeed recorded (the single fastest revolution of the anemometer).
the time and date is also recorded from an onboard RTC (Real Time Clock). The RTC has it’s own battery that should last a
few years. This way if the micro controller ever loses power it will still record the correct time, and I will know that
one or more recording “sessions” failed.
Once all of the data have been recorded from the past ten minutes, they are written to a CSV file on the SD card. The card
is 8 GB and should be able to store decades worth of data before being filled.
An early version of the system also uploaded the data to my personal web server so that It could be downloaded or viewed
without having to pull the SD card. I ended up removing that functionality at the end of the summer because the internet
gets turned off and it would be of no help.
As of June, 2015, one year after being turned on, the device had recorded just over 650,000 data to the SD card. Now I
just have to do something with them...