This project came about because of a common sentiment of mine. The tools I have available are
often a gross limitation to what projects I can undertake. One of the many side projects of mine
is growing spicy peppers. Because I live in a tiny third floor apartment in cold New England,
this means growing plants in pots indoors. To keep plants alive and healthy throughout the year
requires the liberal application of artificial light. Grow lights are certainly available online,
and do work well. But they are incredibly expensive. Additionally, many manufacturers claim that
their lights are better because they put out a special spectrum of light that plants like.
 Some call it “full spectrum” some say “wide spectrum”, but because of my knowledge of how LEDs work,
I was skeptical of these claims. My solution was to engineer my own set of tuned spectrum grow
lights. Light specifically designed to make plants happy, rather than appeal to human eyes.
This required the use of a spectrometer. It is possible to buy a ready made spectrometer. And
I’m sure they work quite well. But they are extremely expensive, as they are usually used in
laboratory settings.
I believed I could make my own, for very little money that would work well
enough to not just be considered a novelty, but be a useful tool for further projects. The main
expense in lab grade spectrometers comes from two parts - first surface reflection parabolic
mirrors, and first surface diffraction gratings. My device uses cheap spherical plastic lenses,
and a cheap plastic diffraction grating from eBay. The benefit of first surface mirrors instead
of lenses is that they do not exhibit a flaw called chromatic aberration. An effect that all
light transmitting devices exhibit. It causes different wavelengths of light to behave differently.
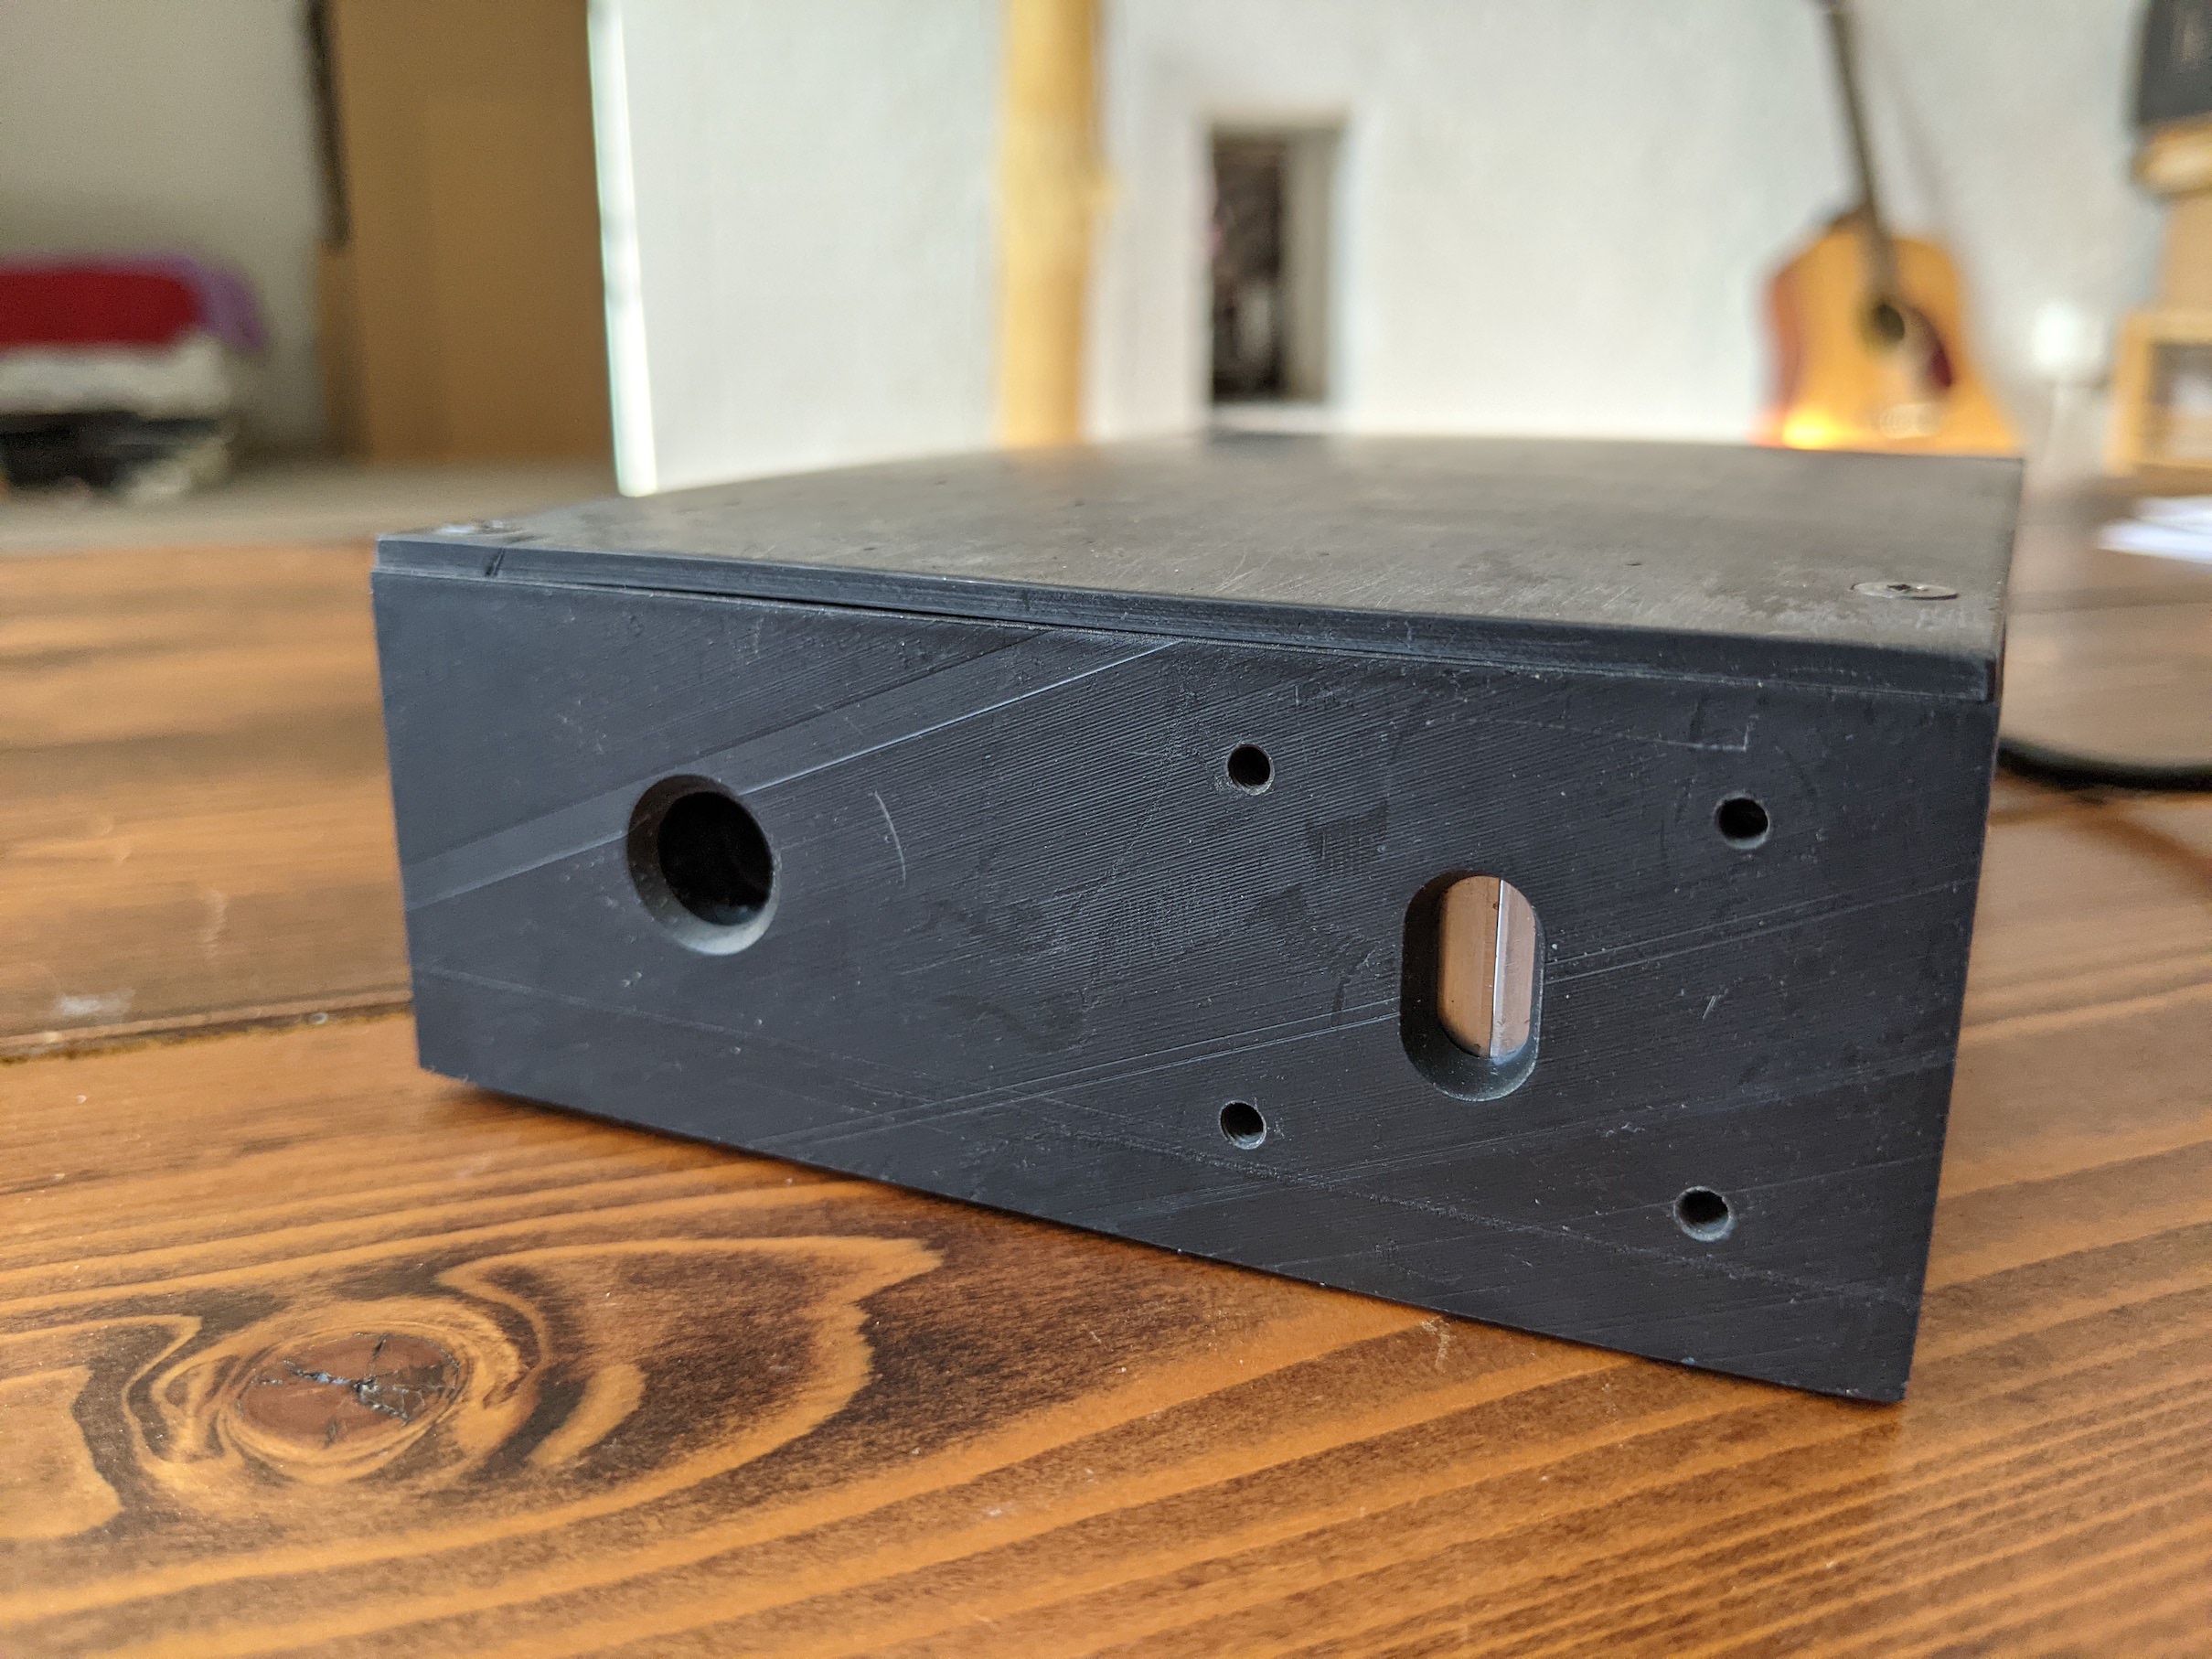
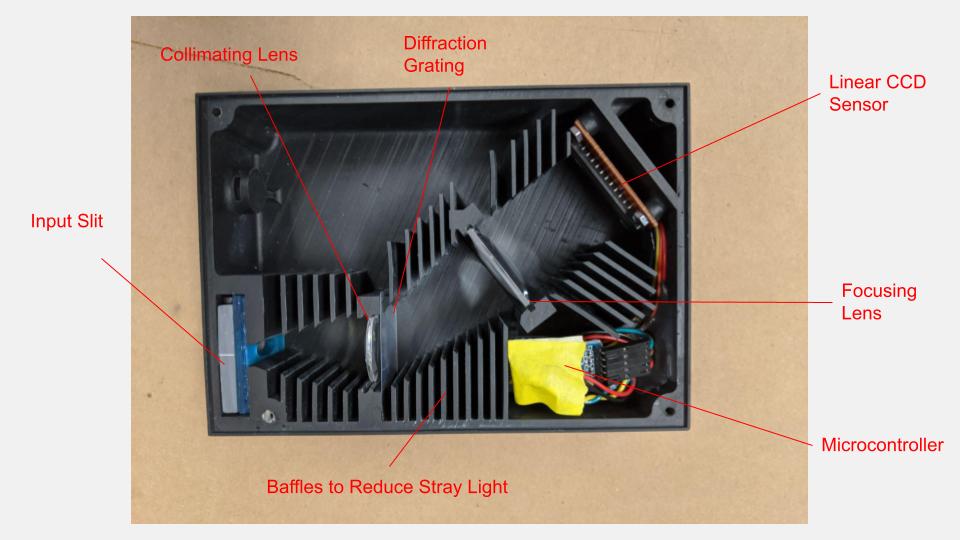
Because mirrors do not transmit any light, they do not have this problem. A diagram of the inside
of my spectrometer can be seen below. It works by first passing incoming light through a very fine
slit. I was able to create this by gluing two razor blades to a 3D printed part with the blades
facing each other.
Some call it “full spectrum” some say “wide spectrum”, but because of my knowledge of how LEDs work,
I was skeptical of these claims. My solution was to engineer my own set of tuned spectrum grow
lights. Light specifically designed to make plants happy, rather than appeal to human eyes.
This required the use of a spectrometer. It is possible to buy a ready made spectrometer. And
I’m sure they work quite well. But they are extremely expensive, as they are usually used in
laboratory settings.
I believed I could make my own, for very little money that would work well
enough to not just be considered a novelty, but be a useful tool for further projects. The main
expense in lab grade spectrometers comes from two parts - first surface reflection parabolic
mirrors, and first surface diffraction gratings. My device uses cheap spherical plastic lenses,
and a cheap plastic diffraction grating from eBay. The benefit of first surface mirrors instead
of lenses is that they do not exhibit a flaw called chromatic aberration. An effect that all
light transmitting devices exhibit. It causes different wavelengths of light to behave differently.
Because mirrors do not transmit any light, they do not have this problem. A diagram of the inside
of my spectrometer can be seen below. It works by first passing incoming light through a very fine
slit. I was able to create this by gluing two razor blades to a 3D printed part with the blades
facing each other.
 By using a laser with a known wavelength, and measuring the diffraction pattern
spacing, I was able to calculate the slit width.
For this application, I used a 15 micron slit. A
larger slit allows in more light, but will not be able to resolve wavelengths as precisely. The
light then passes through a collimating lens. This makes all of the light rays parallel to the axis of the lense.
They then pass through a plastic diffraction grating. This redirects the light
based on its wavelength. The grating that I used has 1000 lines per mm, giving a very large angular
change to the light. The light then passes through another lens. This lens focuses the collimated
light back to a sharp image. Essentially it focuses an image of the entrance slit onto the sensor.
By using a laser with a known wavelength, and measuring the diffraction pattern
spacing, I was able to calculate the slit width.
For this application, I used a 15 micron slit. A
larger slit allows in more light, but will not be able to resolve wavelengths as precisely. The
light then passes through a collimating lens. This makes all of the light rays parallel to the axis of the lense.
They then pass through a plastic diffraction grating. This redirects the light
based on its wavelength. The grating that I used has 1000 lines per mm, giving a very large angular
change to the light. The light then passes through another lens. This lens focuses the collimated
light back to a sharp image. Essentially it focuses an image of the entrance slit onto the sensor.
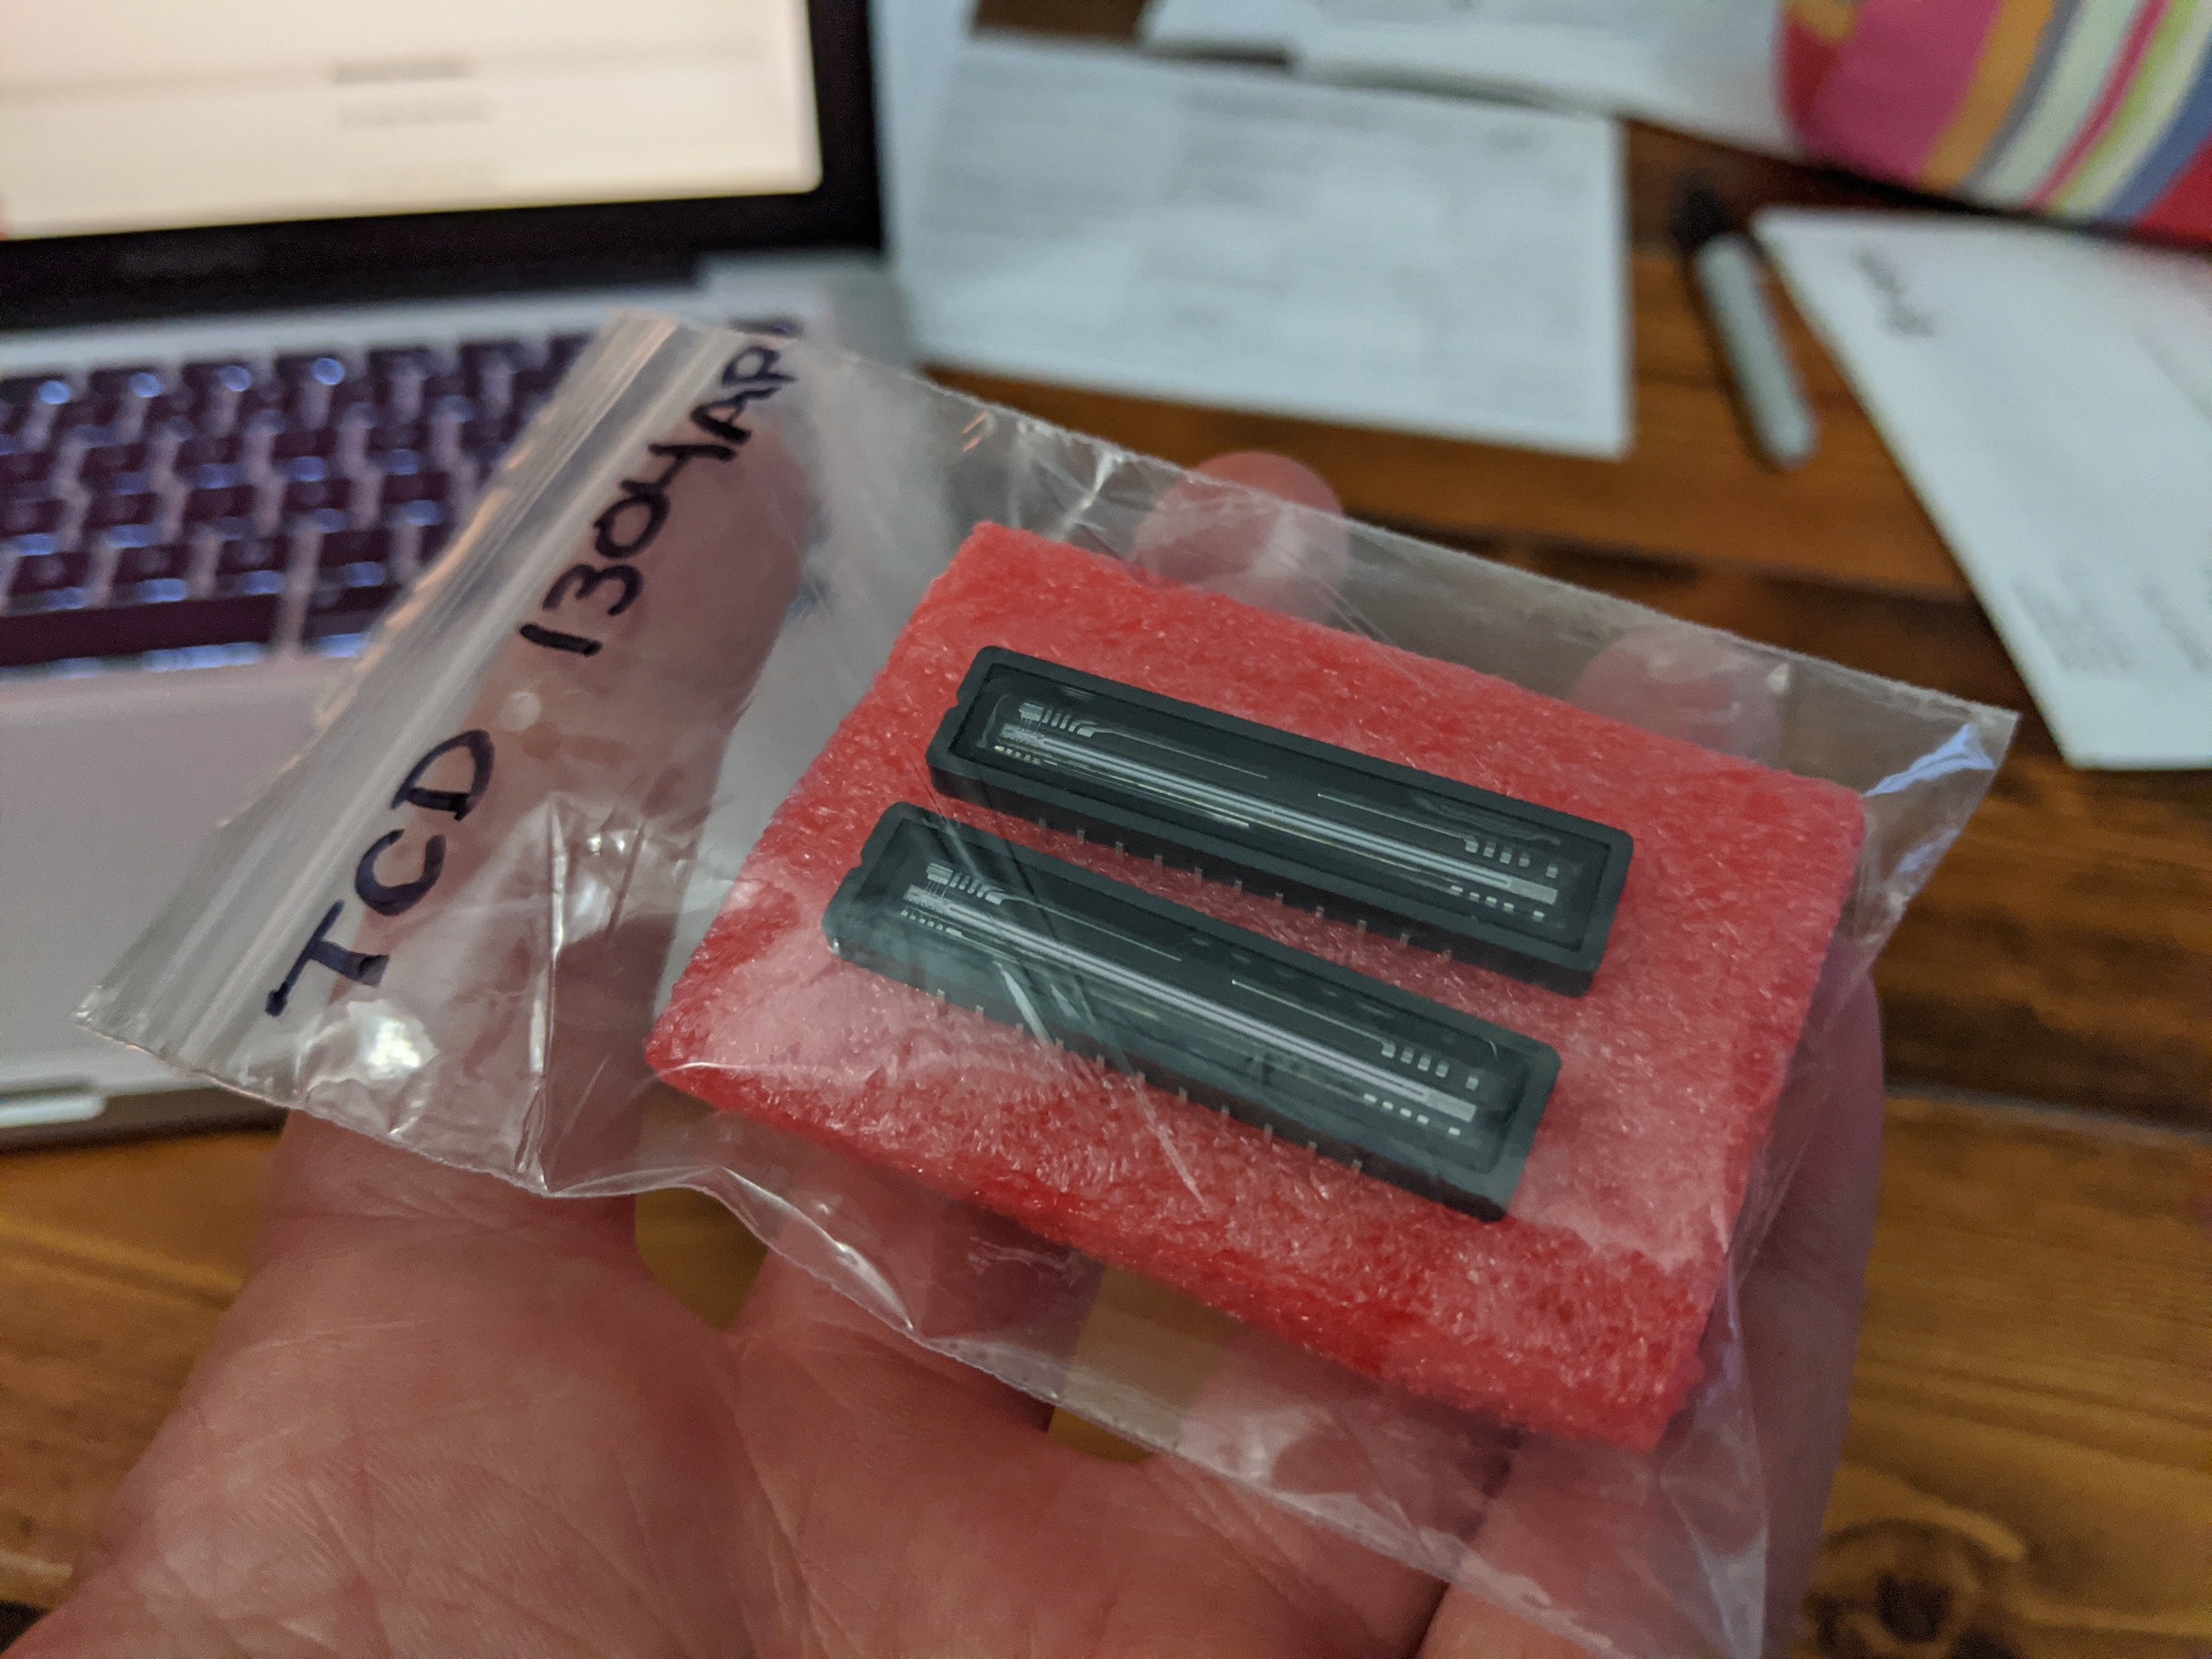
 The sensor is a linear CCD array purchased on eBay. These devices used to be used in flatbed scanners,
and can be purchased cheaply. The one I found has 3600 pixels in a single row about 30 mm long. Each
pixel is less than 10 microns wide, and about 200 microns tall.
The sensor is a linear CCD array purchased on eBay. These devices used to be used in flatbed scanners,
and can be purchased cheaply. The one I found has 3600 pixels in a single row about 30 mm long. Each
pixel is less than 10 microns wide, and about 200 microns tall.
 Because the diffraction grating
redirects different wavelengths at different angles, those different wavelengths each produce a
different slit image on the sensor.
With a bit of math, it is possible to correlate a location on
the sensor to a specific wavelength. An ATMega328p microcontroller controls the CCD sensor, setting
exposure as well as other settings, and reading the values it produces. The microcontroller also
serves as a USB to serial converter. This allows the settings to be controlled from a computer and
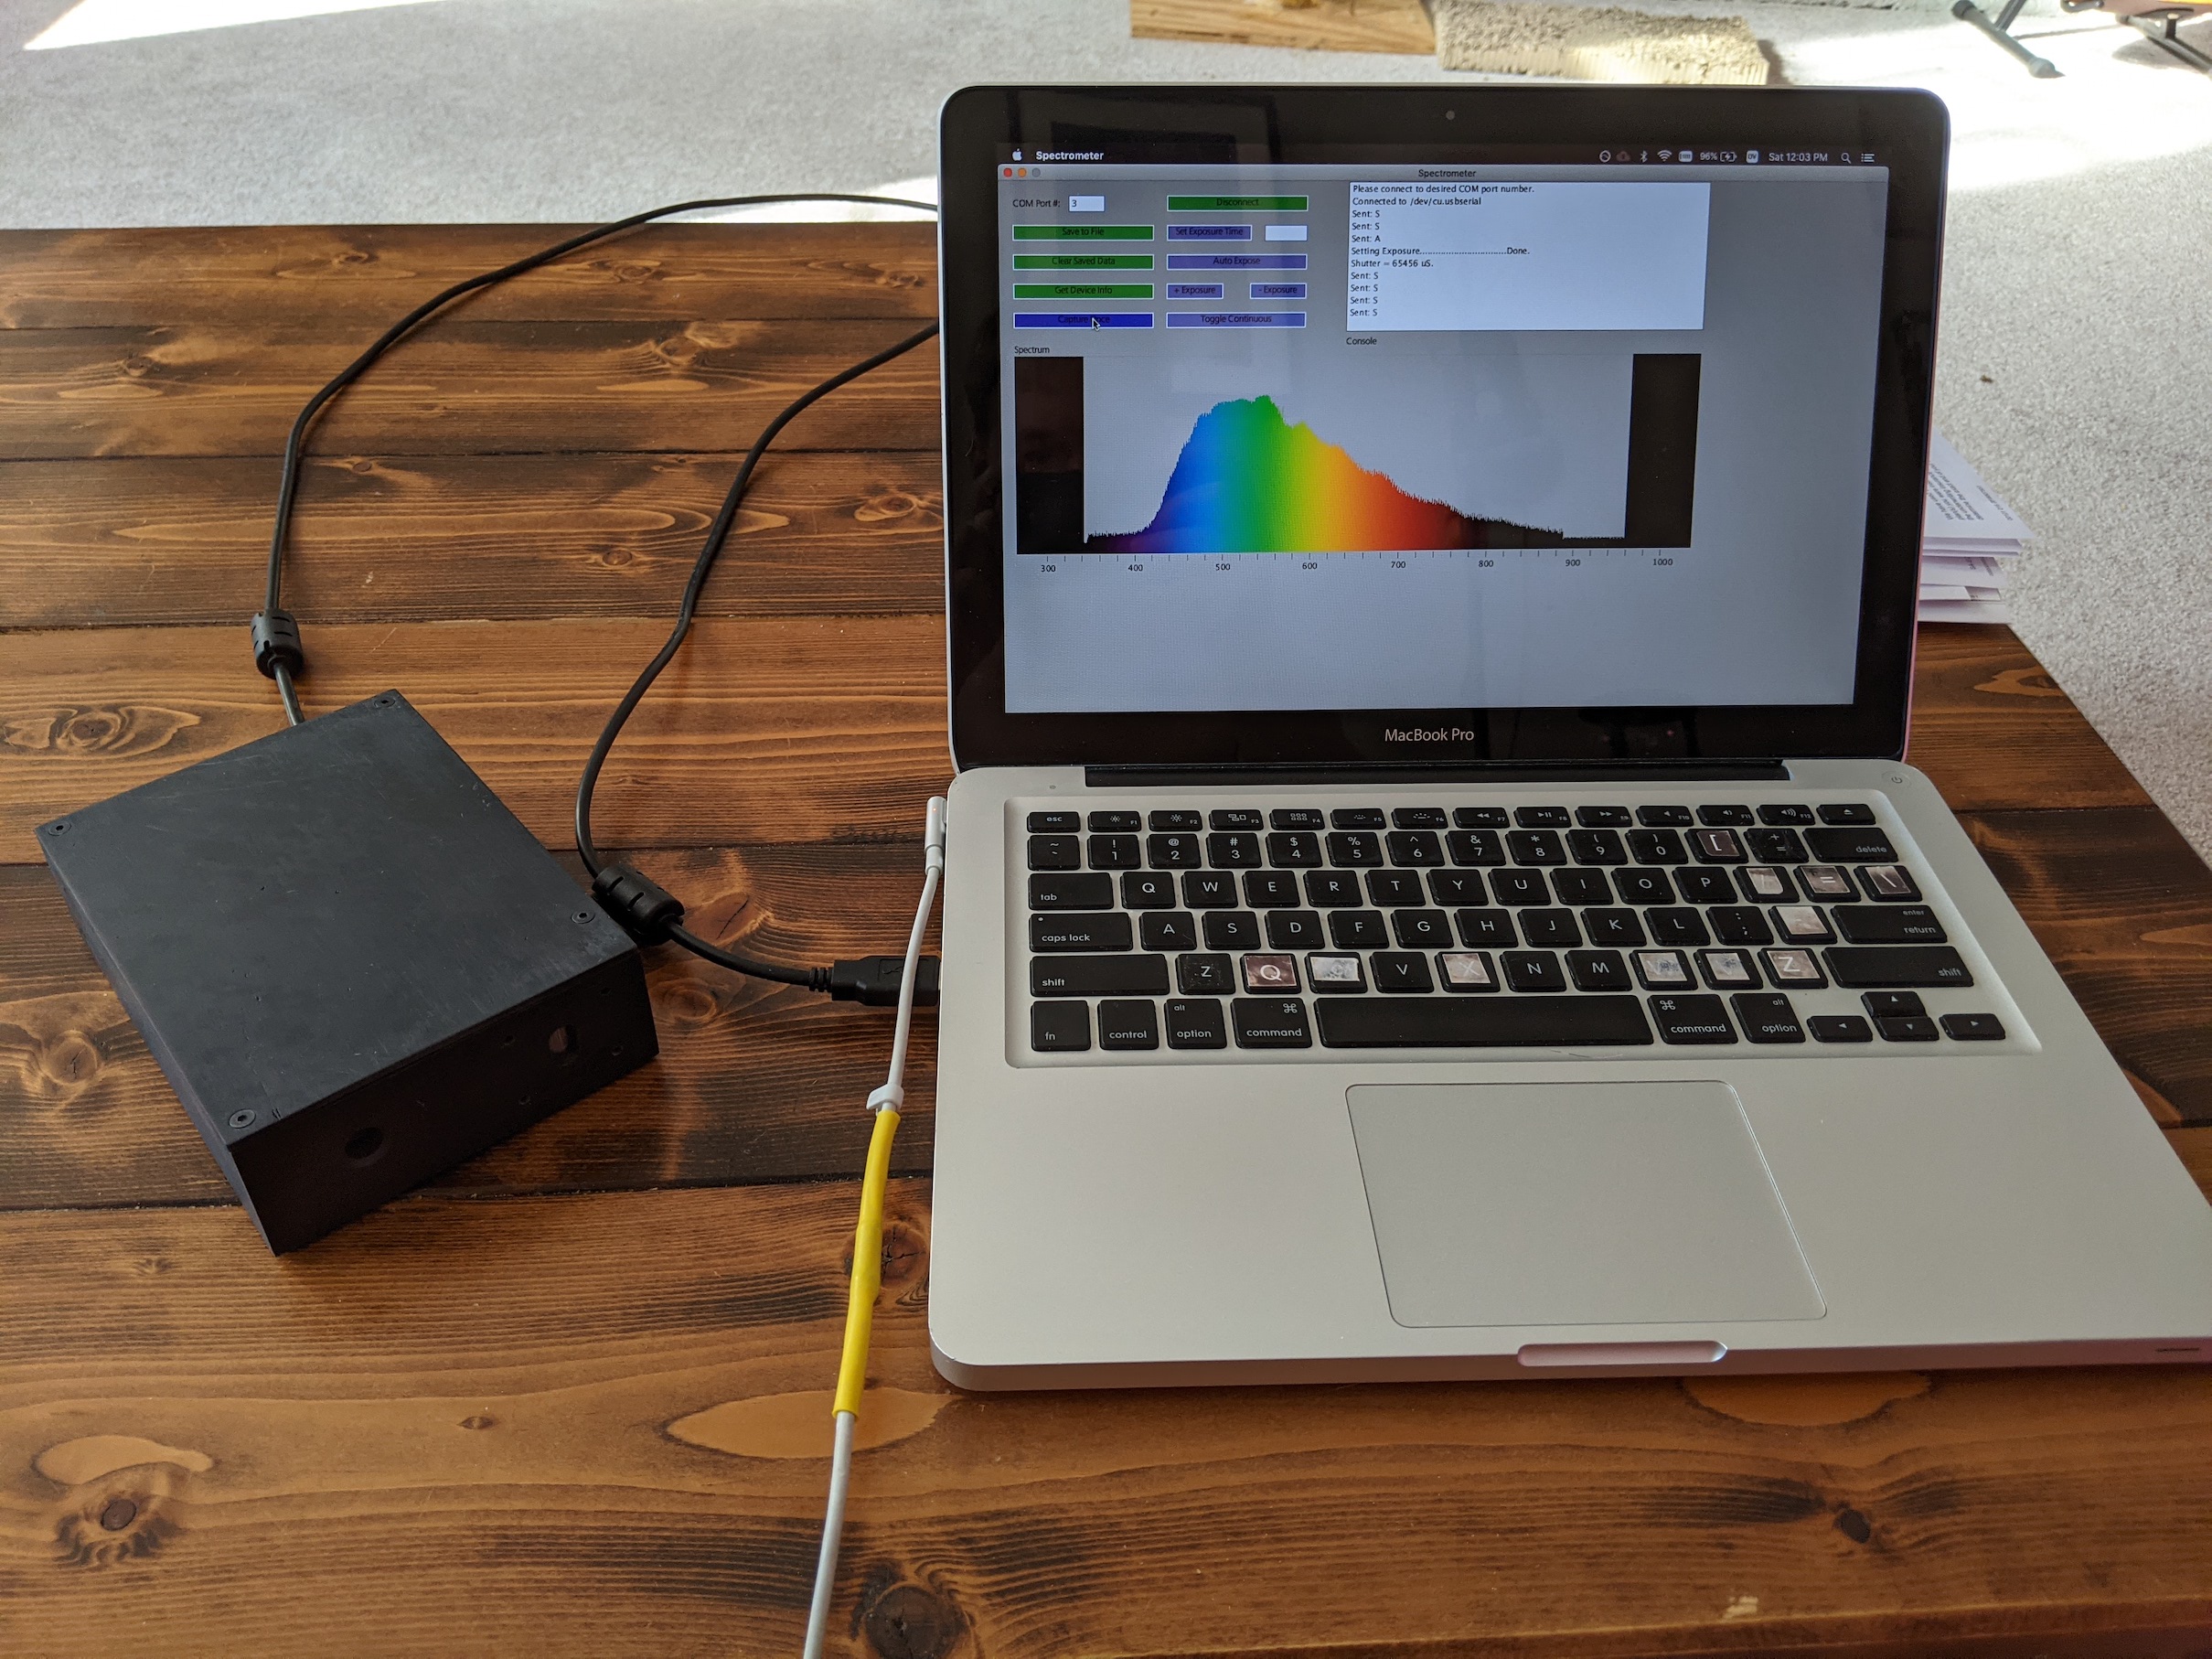
the received data to be visualized more easily. The spectrum images below in this post
were captured from a custom Java application written to interface to the spectrometer. The
application allows for changing the capture rate, exposure, auto/manual capture. It also generates
a visual spectrum representation of the received data.
Because the diffraction grating
redirects different wavelengths at different angles, those different wavelengths each produce a
different slit image on the sensor.
With a bit of math, it is possible to correlate a location on
the sensor to a specific wavelength. An ATMega328p microcontroller controls the CCD sensor, setting
exposure as well as other settings, and reading the values it produces. The microcontroller also
serves as a USB to serial converter. This allows the settings to be controlled from a computer and
the received data to be visualized more easily. The spectrum images below in this post
were captured from a custom Java application written to interface to the spectrometer. The
application allows for changing the capture rate, exposure, auto/manual capture. It also generates
a visual spectrum representation of the received data.
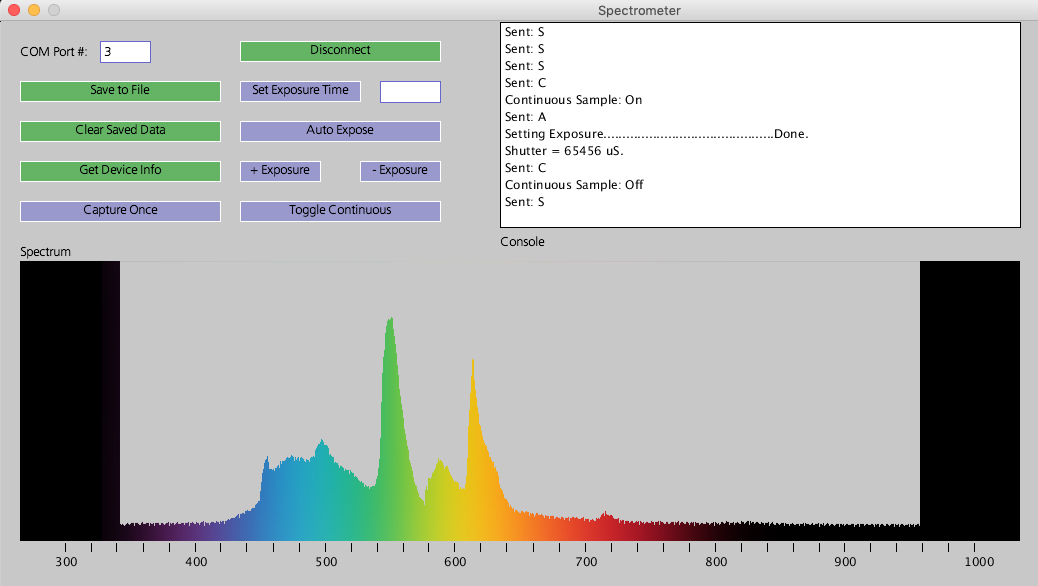 The spectrum in the image above shows the
spectrum of a white flourescent light. You can see the peaks corresponding to the blue, green, yellow, and red
phosphors that coat the inside of the tube. A text box shows commands
and info that have been sent and recieved by the spectrometer, and buttons allow different modes and control, as well
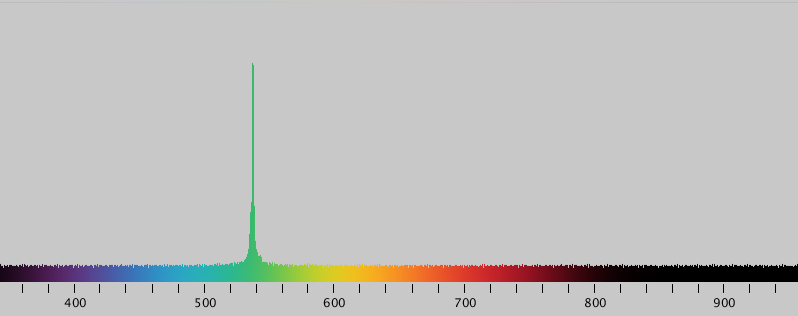
as the serial connection. Below is an image of a cheap green laser
pointer. This shows how extremely narrow bandwidth produced by coherent laser diodes.
The spectrum in the image above shows the
spectrum of a white flourescent light. You can see the peaks corresponding to the blue, green, yellow, and red
phosphors that coat the inside of the tube. A text box shows commands
and info that have been sent and recieved by the spectrometer, and buttons allow different modes and control, as well
as the serial connection. Below is an image of a cheap green laser
pointer. This shows how extremely narrow bandwidth produced by coherent laser diodes.
 The performance of the spectrometer actually slightly exceeded my
calculations! The bandwidth is usable all the way from about 380 nm to about 800 nm. This is well
into the near UV and near IR spectra. The spectrometer has a resolution of just under one nm, and
it can resolve two peaks separated by less than 5 nm. This is almost as good as cheap commercial
spectrometers costing a few thousand dollars, so I’m very pleased with the results. This device
will see a lot of use in future projects.
The performance of the spectrometer actually slightly exceeded my
calculations! The bandwidth is usable all the way from about 380 nm to about 800 nm. This is well
into the near UV and near IR spectra. The spectrometer has a resolution of just under one nm, and
it can resolve two peaks separated by less than 5 nm. This is almost as good as cheap commercial
spectrometers costing a few thousand dollars, so I’m very pleased with the results. This device
will see a lot of use in future projects.